Tuesday, 7 June 2011

Trend for the 7th of June 2011


Euro the leader for a few weeks

Today was another day that saw various currency pairs to continue their swings. As I wrote in my post �Follow the leader� you have to identify the strongest currency (or any other security if you trade other financial markets) and trade in the direction of a trend by going long in that specific currency. If you look at the charts you will clearly see that Euro has been the strongest currency for a few weeks (Japanese yen being the second). 

Canadian and US dollars the biggest losers

Another thing which you have to identify is the weakest currency (or any other security if you trade other financial markets) and put the strongest currency against the weakest currency. In this way you will be able to make maximum profits. If you look through the charts you will see that Canadian dollar and US dollar were the weakest currencies. So, all these two weeks you could go long in Euro and Japanese yen and go short in Canadian and US dollars. 

Eur/usd and eur/cad were the best pairs to go long

Eur/cad was making minor retracements so it would have been impossible to wait for dips and then go long in the pair. You had to take longs each time the pair took out previous highs. It means you had to take breakout trades. This is not a favorite strategy of mine if there are no news around. Therefore I would have preferred to trade eur/usd instead of eur/cad, or use eur/usd as a primary pair for going long and eur/cad as a secondary. 

Possibility in eur/usd today

I have already given you examples yesterday with eur/usd how it retraced to support levels which used to be resistance once, but after being taken out they became support. This is classical technical analysis! So, if we continue talking about price action in eur/usd today you will see how good the pair was for taking long during early European session. It was falling through American session yesterday and consolidating during Asian session. 

At the end of Asian session a beautiful 123 reversal pattern was formed and the pair broke upwards to continue its short term swing. When the news from Europe came it had almost reached its daily high and started going sideways. What you could do is simply place a buy stop order above point two and go up with the market when it cleared the point. 

Reversal in Japanese yen is in the cards

Thinking about the second strongest pair (Japanese yen) I kind of tend to think that it can reverse pretty soon. Oil is bottoming bit by bit. Canadian dollar has reached a pretty important resistance and most Japanese pairs seem to be forming reversal patterns. Eur/jpy is actually breaking up of the reversal pattern and it can be again the leader in the move. Gbp/jpy is also finding support. Even usd/jpy seems to have formed some sort of double bottom on 1 hour chart. 

This data can move markets tomorrow

We have very important data coming from Japan tomorrow (Nominal Gross Domestic Product) and also some extremely important data from Great Britain and Europe (Rate decision). This can set all financial markets on fire. I think that this could also cause oil and other commodities to go up and yen to go down. Let wait to see what tomorrow brings.

Read my previous post:

Support


Disclaimer
Trading financial markets carries a high level of risk, and may not be suitable for all investors. All information on the blog is of educational nature and cannot be considered as advice, recommendation or signals to trade in any financial markets.

Monday, 6 June 2011

Support


What is support?

Trading support is the topic of the post. What is support in technical analysis? I guess the answer to the question is not very complicated. It is a technical level where price came once from top downwards and was not able to fall any further. This becomes an important psychological level for most traders saw that the level held the price and next time the price comes to the level, most probably it will have a lot of buyers there. The more times the level is tested the more important and stronger it becomes. 

Multiple support levels

Very often a downtrend ends when a price of a security fails to break through some low which it tested many times. In this way a range is formed and after that an uptrend usually develops. So, if one is in a range trading support is essential for prices of securities visit the same levels again and again and those levels hold. I usually try to spot a divergence on RSI indicator, flattening Bollinger bands and 123 patterns on various time frames to define my entry points at various support levels. If support fails you should be ready to trade a breakout. 

Support in a trend

When securities are in a trend, support is also a very good strategy that one can implement in making decisions for a trade. If a market is in an uptrend you would often see peaks and valleys as the market progresses upwards. Some traders would enter another trade when a security makes new high. Others wait for pullbacks and buy back at previous resistance (which is now support) or wait for confirmations that a counter trend move is over and it is time to go up again. Various technical tools, some of which have been mentioned above are used to define when a counter trend move has finished. 

Wait for confirmations before trading support

I also like waiting for the price to hit the same level twice to find some short term bottom before I go up with a trend. The double bottom usually ends up with 123 pattern and strengthens the idea of a real reversal. In trading currencies I would wait for European session to start for currencies are usually consolidating during Asian sessions and forming bottoms during a short term counter trend move. During European sessions volatility goes up and market usually takes its trend oriented direction. This may very with other securities, but there usually is a tendency for a move in the direction of a trend to continue when a trading day starts. 

Check support on various time frames

If you want to see support and resistance levels clearly I would encourage you to put trend lines on the places where prices came and were rejected. This will give you a better perspective of where you can see support and resistance next. You should train yourself to do that on multiple time frames. It is better to start with monthly, weekly and daily charts, before you proceed to hourly and minute charts. Longer time frames give you a perspective on the big picture and smaller time frames give you clues on where to enter and exit the market. When you train your eye to spot support levels on longer time frames it will become much easier to do it on smaller time frames for the same basic principles are applied on all time frames. If you use only smaller time frame you might become a short sighted day trader, if you use only long term time frame you will miss a lot of opportunities that happen in financial markets on daily basis. So try to find balance between those time frames. 

Read my previous post:


Disclaimer
Trading financial markets carries a high level of risk, and may not be suitable for all investors. All information on the blog is of educational nature and cannot be considered as advice, recommendation or signals to trade in any financial markets.

Sunday, 5 June 2011

Bollinger bands


Bollinger bands intro

Bollinger bands is the topic of the post. It is a technical indicator developed by John Bollinger in 1980�s. In the words of John Bollinger himself this indicator should provide a relative definition of high and low. The indicator itself like many other technical indicators should not be used alone but in combination with other indicators of a different nature such as RSI and money flow. 

Structure of Bollinger bands

Indicator consists of three parts: upper band, lower band and the middle band (which is usually 20 sma). When a price of a security reaches the upper band we may assume that prices are high, when it reaches the lower band we assume that prices are low and when it is fluctuating around middle band we may assume that prices are neither overbought nor oversold and could actually be going sideways. 

Bollinger bands and M patterns

I like using Bollinger bands, especially for finding potential bottoms and tops in financial markets. Those are usually found as M patterns for tops and W patterns for bottoms. They can be typically known as double tops and double bottoms and Bollinger bands indicator helps us to identify those. Especially if you look at long term charts! A typical reversal in an uptrend happens after a security has been in a trend for some time. One day it starts going back sharply, then stops and tries to revisit its' previous high. It usually fails. This going down causes bands to flatten and when the security comes back to retest its previous high it usually hits upper band which now acts as a resistance. Then the security starts collapsing and goes through its� previous lows. 

Bollinger bands and W patterns

W pattern is formed in a downtrend when a security has been going down for some time. At some point it rallies up. Then it starts coming down to retest its� previous low. This rally causes bands to flatten and when the price of a security reaches previous low or comes close to it, it hits the lower band, which acts as support now. After that the security usually reverses and starts climbing up. 

Bollinger bands in ranges

Bollinger bands are also very good in range bound market, when securities are fluctuating between highs and lows of their ranges. In those particular periods bands are usually pretty flat and act well as support and resistance areas. It is advisable of course, to implement some other technical indicator and various reversal patterns to trade with the bands, and not to take a touch of a lower or upper band as a sign to sell or to buy a security. Take RSI divergences (on 8 hour chart) as an additional indicator and you will get pretty powerful signals to follow. 

Bollinger bands and trends

One can also use Bollinger bands to identify emerging trends. Prices closing beyond the bands might signal not a reversal and coming back to the range, but a breakout that can lead to a prolonged trend in securities. It means you need to look for opportunities to enter positions in the direction of the move and keep them before you see any serious signs of reversal (bands flattening). 

Conclusion

So, as you may see Bollinger bands can be used for trading any type of market under various market conditions: ranges, trends, reversals. What you should remember is that it is not safe to use any indicator alone without getting some confirmation from other technical indicators. Try to play with Bollinger bands on various times frames to see the big picture and identify the most important levels of support and resistance. I hope you will learn to use the tool profitably. 
I will post more charts in the coming week (after repairing my computer).

Read my previous post:


More on Bollinger bands visit John Bollinger site:

http://www.bollingerbands.com/

 
Disclaimer
Trading financial markets carries a high level of risk, and may not be suitable for all investors. All information on the blog is of educational nature and cannot be considered as advice, recommendation or signals to trade in any financial markets.

Saturday, 4 June 2011

Divergence


Divergence is the topic of the post. I have used the term in a lot of posts of mine and want to talk about it in more detail today. 

What is divergence?

I would define it as a descrepancy between price action and indicator action. It means that price is moving in one direction (let�s say up) and indicator starts moving in the opposite direction (down). This is a divergence between the price of a security and the values of indicator for the same security. The most popular indicators that are used for this are MACD, RSI and Stochastics. I prefere MACD and RSI. 

Types of divergences

If you have read anything on the topic you should know that there are basically two types of divergences and they can have two subtypes of their own. Let us define them.
The two types of divergences are Regular Divergence and Hidden divergence. They have two subtypes: one for an uptrend and one for a downtrend. 

Regular divergence

I.                    Price is making news highs and indicator is making lower highs (in a swing up).
II.                 Price is making new lows and indicator is making higher lows (in a swing down).

Hidden divergence

III.               Price is making a higher low while indicator is making a lower low (in a swing up).
IV.              Price is making a lower high while indicator is making a higher high (in a swing down).

How to apply regular divergence

Let us look at regular divergence first. Regular divergences are best used in range bound markets and it gives us a sign that a market might reverse soon. It is not very good in longer term trends, because it produces too many false signals before the market finally reverses. When you start seeing a divergence (let�s say on 4 hour chart) in a range bound market you should start searching for opportunities to enter a position in the opposite direction market is at that given period of time. You should not hurry to jump into a trade right when you see a divergence, but wait for reversal candles, broken support levels, news releases or 123 patterns on smaller time frames to tell you that it is time to take a trade.

How to apply a hidden divergence

However, when a trend starts you should not follow these kind of divergences, but rather play against them. What you want to look for in a trend is a hidden divergence. Hidden divergence usually shows overbought levels in a downtrend and oversold levels in an uptrend. It means that during corrections in a trend it shows you the level when correction or counter trend move should end and it is time to get back into a trend again. In an uptrend, a price of a security suddenly starts collapsing but does not reach previous low. However, indicator shows lower values than the values of the indicator during previous low. The same is true for downtrend. The price of a security rallies but does not reach previous high. However, indicator shows higher values that the values of the indicator during previous highs. Again, what you want to see before jumping into a trend trade again are: reversal candles, broken support levels, news releases or 123 patterns on smaller time frames.

Conclusion

So, when you see that a price of any security is in a range you use a regular divergence to trade reversals in a market. Those usually happen at the ends of the range (important support and resistance levels). When you see that a price of any given security is in a trend you use a hidden divergence to trade continuation of a trend. This usually happens at the end of a counter trend move. Good luck in trading divergences.
Read my posts:


Disclaimer
Trading financial markets carries a high level of risk, and may not be suitable for all investors. All information on the blog is of educational nature and cannot be considered as advice, recommendation or signals to trade in any financial markets.

Friday, 3 June 2011

Trend for 3rd of June 2011


Trading week is over and let us look at price action in currency markets today. It was a big day, for the data of Non Farm Payrolls came out today. You have to mark this event on your calendar and always be ready to take advantage of the data as well as be careful trading it. I remember my early days in trading forex market. I started by trading news, but as I did not know much about trading and managing capital I had to go through a lot of bitter experience. I very clearly remember myself trading my first Non Farm Payrolls event having just a few weeks of experience on a mini account with Refco broker (bankrupt now). 

You must have noticed that occasionally market starts moving one direction before the news and when it comes out it jumps into the opposite direction. That�s what happened with me that day. My sell order was opened and after about 10 seconds the market exploded upwards. Platform was not able to close the short order and I was sitting there desperately trying to close it manually. Fortunately, I was able to finish the day at breakeven by closing the sell order and opening a long one. This also taught me a lot about risk and capital management. If you want to trade the news you will have to be ready for a lot of problematic situations that might happen when news is released. I will talk about them some time in the future when I write a separate post about news trading. 

I would say that if you a news trader today was a turbulent day for you. It does not mean you couldn�t have made any money, but you would have probably experienced a �whipsaw�. If you opened 1 minute chart you would see how the price in eur/usd, gbp/usd and other similar pairs jumped up (meaning your long order would have been opened), then after two minutes the prices started going down and reached the other end of the range and below it (meaning your short order would have been opened). Then the price again reversed and went upwards. Well, if you traded gbp/usd you might have probably avoided this, but eur/usd would have done you just that (two orders opened and then closed). I view it as a pure manipulation done by �big dogs�. 

Anyway, if you do trade news you have to play under conditions that you have and one of the ways to play this situation is to put buy and sell stop order again (after the first ones are closed by market). So, let's say you traded eur/usd. Your long order was opened and after a few minutes stop hit. Then your short order was opened and after a few minutes the stop for the order was also hit. What do you do? You again place long stop order above the most recent high and sell stop below the most recent low. This kind of behavior would have put your trading today on breakeven. I cannot show you the charts yet (problems with computer) but you would have placed your second set of orders in this way: eur/usd (buy stop order at 1.4535 and sell stop order at 1.4445). Your long order would have been opened and you would have probably closed at a round number of 1.4600 (a few pips below that). That would have left you at breakeven. I hope you had some profit today though. 

That much for today, I am going to write on some technical aspect of trading tomorrow. I hope I will be able to include some charts tomorrow. See you.

Read my previous post:


Disclaimer
Trading financial markets carries a high level of risk, and may not be suitable for all investors. All information on the blog is of educational nature and cannot be considered as advice, recommendation or signals to trade in any financial markets.

Thursday, 2 June 2011

Trend for the 2nd of June 2011


Today was another volatile day in various markets. Let me begin with the British pound. It was a good opportunity to trade the currency from a technical perspective today. If we take into account that pound has been falling for a few days, we know that we have to search for possibilities to play pound pairs from bearish side. The way to do it is not very complicated. You need to wait for a rally that would reach a resistance or overbought levels on smaller time frames (15 minute chart recommended) and finally develop a reversal pattern. 

At around 8 GMT pound pairs (gbp/usd and gbp/jpy) rallied and at around 10:15 GMT reached the peak. Then pound started collapsing. Gbp/jpy did not form a nice technical reversal pattern, but gbp/usd did. If you looked at 15 minute chart you can clearly see both head and shoulders technical pattern and a famous 123 reversal structure. I hope you know what you had to do. The best thing was to place a sell stop below the number 2 point and when it was hit again, you simply had to follow the market till most recent low of 1.6310 level (support). 

It looks like the pair formed some temporary double bottom pattern at the level. It will be confirmed if the pair is able to go up through most recent resistance at 1.6420. Short term support starts at 1.6345. If the pair goes back to this level and again forms a 123 pattern, preferably at the time of European session, it would be a sign for me to enter a long order in the pair. If oil continues to rise (which he did today) gbp/jpy might join the move up. Let us see if the market ready to take bullish actions in pound pairs. 

A very similar story happened to silver today. As markets are global you can see some securities behaving in the same way at the same time. We can see that silver started a rally much earlier than gbp/usd. It found its short term bottom at 19:45 GMT yesterday and it was climbing up till the end of European session. Then it formed 123 pattern and started going down around 45 minutes earlier than pound did. It is again sitting on another support level (yesterday�s support of 36.30 was broken). Now it is resistance and the commodity might try to take it out. I am not sure if it will be able to do it. 

At present I am more inclined to think that silver is going to 33.00 level and it will start bottoming there. So, if you want to day trade with it you can sell, but be very careful with it for silver has a lot of bull waiting to buy it. I am one of them. I would better recommend playing with pound pairs and other currencies in day trading and keep silver for investing. I believe that would be a good way to diversify. Good luck. 

Sorry, I am having problems with my computer and will not be able to display charts for a couple of days. Hope to solve the problem soon. 

Read my previous post: 


Disclaimer
Trading financial markets carries a high level of risk, and may not be suitable for all investors. All information on the blog is of educational nature and cannot be considered as advice, recommendation or signals to trade in any financial markets.

Wednesday, 1 June 2011

Trend for the 1st of June 2011


Rumors about new mines of platinum

Markets were pretty wild today. A lot of currencies and precious metals developed sharp daily trends. Let me start from metals. Most probably you have seen a collapse in silver today. What do you think the move down was based on? Personally I heard a rumor that new platinum mine was found in ZAR. Well, I do not really believe that. I think it�s just big guys trying to manipulate the market and push the price of the commodity where they want to see it short term. It could be a good opportunity for them to buy it at much better prices. 

My bullish expectations for silver

I still hold to my bullish position towards silver and not going to change it as long as printing of money does not cease. I do not believe it will happen very soon and I do believe that we will see another wave of crisis. When that is over, silver will collapse. At the moment I expect the commodity to find support around 33 dollar per ounce level. It sits on intermediary support now (36.30), but I am not really sure if the level will hold this week. Sell stop orders could be placed below the support if one is a day trader and long orders can be taken now if one is a long term investor. However, if you are taking longs now you have to place stops far away, because nobody can guarantee that 33.00 level will hold. So, do not risk more than you can afford to lose. 

Pound collapses

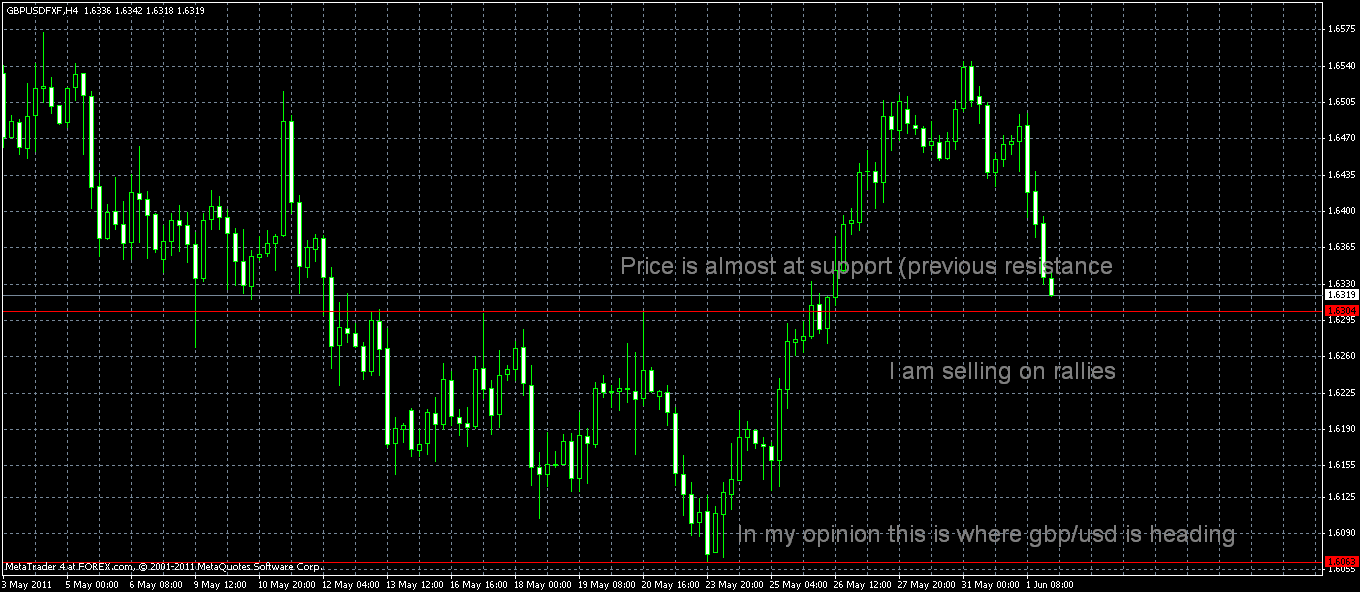
Another thing which I guess you have noticed today was collapse of British pound. What could be the causes of it and could you have traded pound pairs profitably? Yes. If you follow economic news releases you knew that there was a piece of news scheduled to come from Great Britain at 8:30 GMT (Mortgage Approvals and Purchasing Manager Index Manufacturing). The data is of medium importance, but as you can see it created large pound liquidation today. Both gbp/usd and gbp/jpy collapsed. 

Gbp/usd near previous resistance

If you look at gbp/usd you will see that it is very close to its previous resistance 1.6300 level (now support). I believe the support should hold at least for a few sessions. There is some data of medium importance from Britain tomorrow at 8:30 (Purchasing Manager Index Construction). Today you saw what data of medium importance can do. So, be careful and don�t have open positions at the time the news is released but be ready to play with stop orders to go in the direction of the market when news is finally released. The short term trend for pound is down for it has been going down for two days now. This could change tomorrow. However, the strategy remains simple: sell on rallies near resistance levels. Previous support levels should act as resistance now. RSI overbought levels on 15 minute chart and 123 reversal patterns should help you to identify entry levels. 

Let�s wait and see what tomorrow brings. 

Read my previous post:


Disclaimer
Trading financial markets carries a high level of risk, and may not be suitable for all investors. All information on the blog is of educational nature and cannot be considered as advice, recommendation or signals to trade in any financial markets.