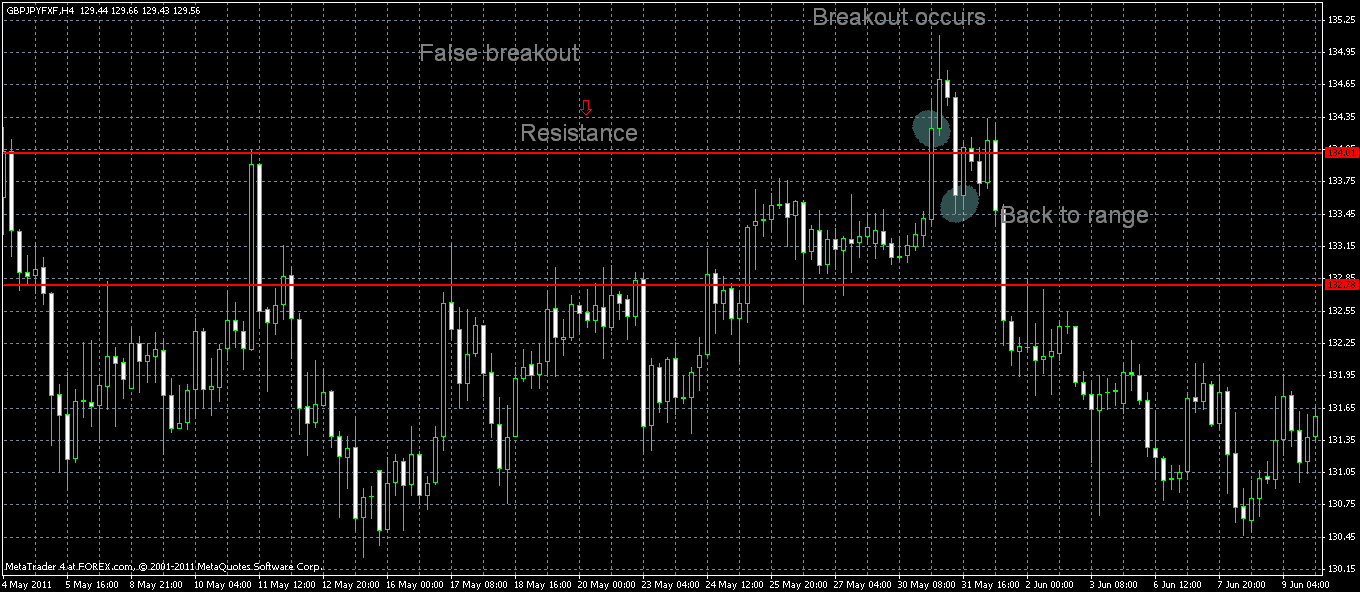
Breakout trading strategy is probably one of the best known in financial community of technical traders. When used properly it can increase your chances of making significant amounts of money on a monthly basis. This trading system is in my trading arsenal on a regular basis and I recently made some nice cash by trading a breakout in Gold. Various breaks happen quite often even daily in various securities. We, however, want to find the best opportunities that can give us the biggest rate of return with the smallest amount of risk. Let us look today at the way one can trade breakouts.
What kind of breakouts to trade?
Breakouts happen daily on various time frames: weekly charts, daily charts, hourly charts and most often on various minute charts. The smaller time frame the more false breakouts you have. Therefore, I tend to avoid minute type of breakouts and concentrate on breakouts on daily charts. Of course, you can clearly see those on 4 hour or 8 hour charts too. I like to go through various time frames at the end of the day to see whether some securities are ripe for a breakout or I need to concentrate on other ways to trade the markets.
Necessary condition for a breakout
Breakouts occur when price move out of �congestion areas�. These are very tight ranges with prices moving within very limited range for a couple of days or a week. These congestion areas are often formed when security loses momentum after some prolonged swing or a short term trend and the move stalls. In these kinds of ranges we look at the low and the high of prices and mark these as possible breakout areas. When broken after some news or simply technically one can expect a strong move and should be ready to place buy or sell orders depending on whether the breakout occurs upwards or downwards.
These kind of breakouts are sometimes corrections of a prevailing swing or trend and the price often moves against the trend that had previously been pushing prices. I dare to trade these breakouts against the prevailing trend. Although one should concentrate on a prevailing trend and trade in the direction of it, there are choppy trends that can provide you with both opportunities to trade with the trend and against it.
Breakouts in GOLD

The most recent examples are from my two trades in GOLD. The first breakout occurred in the direction of a prevailing trend (downtrend). In the beginning of February (1st through 11) Gold got into a congestion area of 1684-1661per ounce. By looking at shorter time frames I understood during the weekend that the break low will occur probably on Monday and I entered a short order below 1663 level (a little above than the low of the congested area) as I did expect the collapse will get momentum falling even before the low of 1661 was reached. Any time the price rose trying to go through the upper level of the congestion it was met by strong bearish pressure, which can be clearly seen from 4 or 1 hour candles of that period. Bulls got weaker and weaker and for any experienced technical analyst it must have become clear that the path of the least resistance in GOLD at that period was DOWN. Unfortunately, I expected the commodity to stay in its� �then� range and bounce from 1630 level. This did not happen as the price of the metal collapsed through the floor and went as low as 1555 level. So, I took my profits at 1.6550 level (13 bucks per ounce profit). Well, what a move (extra 100 buck down) missed! However, I still made nice cash. I saw the congestion, bet on its� break and was rewarded for successful speculation. So, can you!

If you want to make extra money and are ready to trade Forex, futures, indexes and stocks I recommend Etoro.
The second congestion occurred on March 1-11 as GOLD was 1587-1564 range. Looking at the congestion on 4 and 1 hour chart and inspecting the price action it became quite clear that the commodity found strong fresh buyers and GOLD would run up soon. Now, the chart below is not really what I have on my trading platform. Below you can see the price going through the resistance level and falling back on the 7th of March. It did not really happen until the 12th of March (check other charts I cannot upload the one on my platform as it does not have copy function). So, the price stayed within the cage of the above mentioned boundaries till the break up on Monday of March 12.

Study 4 and 1 hour candles and see how falling to the lower part of congestion area bullish candles emerged indicating that strong buying picked up. Trust this kind of price action as it often shows that bigger move is coming. In the second situation the break upwards was short lived, but it was still a nice move and I significantly increased my account by trading the breakout. I exited a few bucks before the critical 1600 level as I saw price stalling.
Exits
The standard take profit area can be measured by calculating the height of a congestion area and adding the amount to the breakout area. However, from time to time the target is not reached and you can trail your stop by moving it below/above (depending on which direction the market goes) 1 or 4 hour candles until you knocked out of your trade. Alternatively you can open a few trades and close the first one as soon as it shows some profit and leaving the second one to go with the market till your stop is knocked out (it maybe below/above 1, 4 hour or 1 day candles). If the move is very strong you can stay longer in the market. I missed it with my first trade. Anyways, do not allow your profits to become losses in any of your trades.
So much for breakout trading strategy! Hope to write soon on the subject as we have a pretty interesting week ahead of us with FOMC rate decision and a few other very interesting risk events.
Ok. I hope you benefited from the post. If you liked the post I would also be happy if you gave a plus on Google+, tweeted, liked it on Facebook and other social platforms. Have a nice day.
Vytas.
Disclaimer
Trading financial markets carries a high level of risk, and may not be suitable for all investors. All information on the blog http://trend0.blogspot.com/ is of educational nature and cannot be considered as advice, recommendation or signals to trade in any financial markets.